Once you have completed all required fields and clicked 'Complete', the product is created and saved. The Edit button at the top right of the screen allows you to modify the product.
The 'Direct Material Cost' section displays a table with the selected commodities. After selecting the required date range and currency, you can review the table.
- Item: Displays the commodity, component or manually added price elements.
- Region: The selected region for the commodity
- Start: The price at the start of the selected period
- End: The price at the end of the selected period
- Average: The average price during the selected period
- Change: The absolute price difference between the start and end of the selected period
- Change in %: The percentage difference between the start and end of the selected period
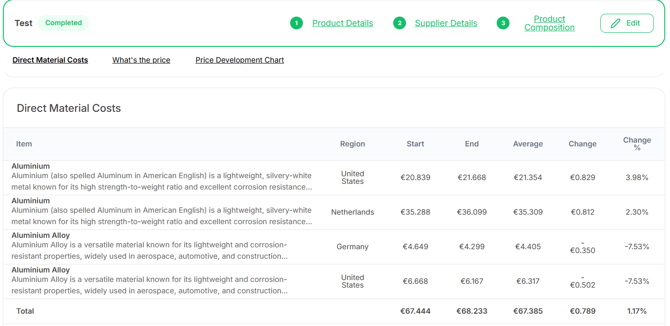
Use this table to analyse how changes in commodity prices affect your product cost.
Direct Material Chart
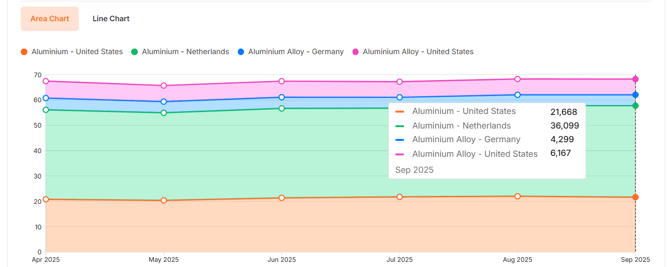
Click 'Direct Material Chart' to view how the total direct material cost changes over time. You can choose between an Area chart or a Line chart.
This view provides a visual overview of the product composition and commodity price trends. Use this chart to identify seasonal trends or significant price movements.
What's the price
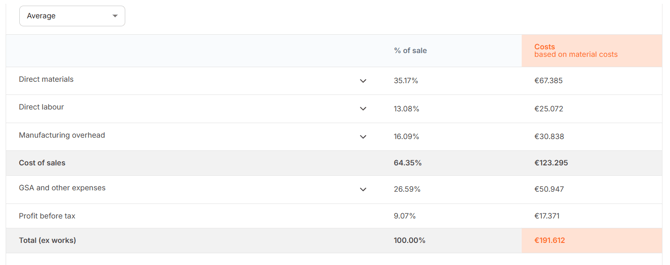
To review the full should-cost model, click on 'What's the price'. This page displays the should-cost breakdown.
At the top, you can select which price type you want to view. By default, the table shows the average price.
In the table, you can expand each cost driver. These cost drivers are based on the selected Industry Cost Profile, but the corresponding percentages are determined by the chosen industry, country and commodities.
The Total at the bottom of the table represents the calculated should-cost of the product. It is based on the selected Industry Cost Profile, commodity prices, labour, overhead and other cost drivers. Changes to commodity prices, regions or the selected Industry Cost Profile will affect the cost breakdown. Compare the should-cost with your own purchase prices to identify potential cost-saving opportunities or negotiate with suppliers.
Price Discipline
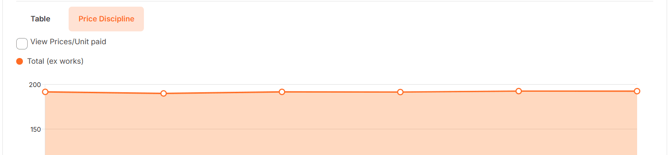
To view the price trend of the complete product, click 'Price Discipline'. If you have added historical purchase prices, you can click on 'View Prices/Unit paid' to display them in the chart. Compare these prices with the calculated should-cost to identify pricing opportunities and analyse trends over time.