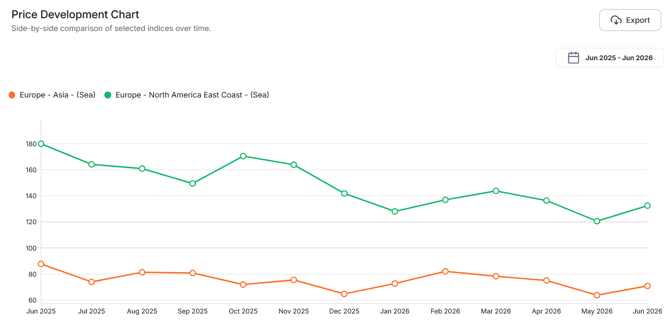
Freight Indices provide insights into market price developments for different transport routes. To access Freight Indices, navigate to Prices & Indices > Freight Indices.
Date Range
First, select the desired Date Range. Selecting a longer date range makes it easier to identify long-term price trends and determine whether freight rates are currently relatively high or low. The selected indices are displayed as percentage changes over time.

Adding an Index
Step 1: Use the '+ Add indices' button to add indices to the chart.
Step 2: Select the required 'Transport mode'.
Step 3: Select one or more freight indices.
Use the search bar to find the correct route(s) if necessary. You can select up to 5 freight indices. Comparing multiple freight indices helps you analyse regional differences and transport cost trends. Confirm your choice by clicking 'Confirm' at the bottom right.
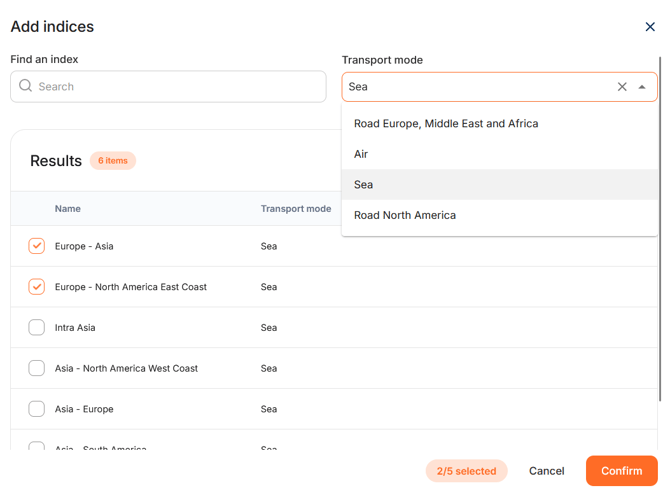
After confirming your choices, the section 'Selected indices' shows your selected indices in a table view. You can add new indices or remove existing ones.
The Price Development Chart displays the selected indices in a line graph. Click Export to download the chart data.