
Table Results
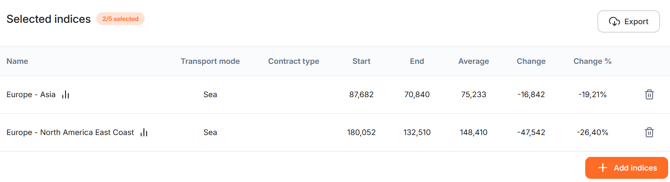
After selecting one or more freight indices, the 'Selected indices' table displays:
- Name: The chosen transport route
- Transport mode: The selected transport mode (Air, Sea, Road'
- Contract type: Indicates whether the index is based on contract or spot prices
- Start: The initial value of the index at the selected starting point
- End: The final value of the index at the selected end point
- Average: The average value over the selected period
- Change: The absolute difference in value between the start and end of the selected period
- Change in %: The percentage difference between the start and end of the selected period
These values are also displayed in a line chart, making it easier to identify trends over time.
After selecting the indices, the Price Development Chart displays:
- Y-axis: the index value expressed as a percentage
- X-axis: the selected date range between the start and end of the selected period
Hover over a point in the chart to view the index value for specific date.
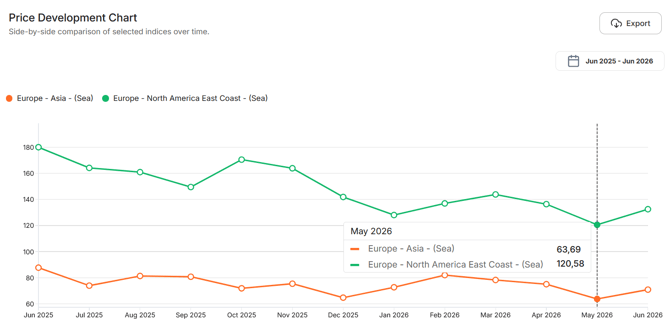
Use the table and chart together to analyse freight price trends and compare different transport routes over time.