Once you have created a freight lane, WTP displays the results.
At the top, you can see the summary of the chosen settings. If you want to change anything, click 'Edit'.

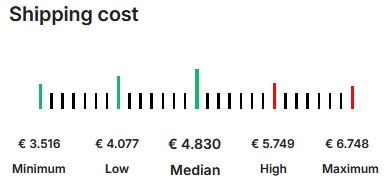
On the left-hand side, you can see the average costs. WTP displays the minimum, low, median, high and maximum market prices. Use these values to compare your transportation costs with current market rates.
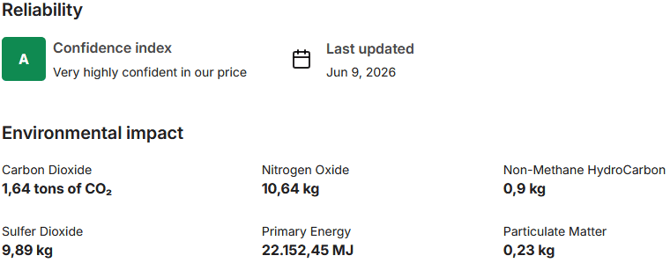
On the right-hand side, you find the reliability. The Confidence Index is based on the amount of market data vailable for the selected freight lane. A very high Confidence Index, indicated by the letter A, means a large number of price observations are available for that freight lane. As a result, the data is based on multiple price points and is highly reliable. If there is a low Confidence Index, indicated by the letter D or lower, the result is less reliable because fewer market prices are available.
Below the Confidence Index, you can find the environmental impact of the selected freight lane.
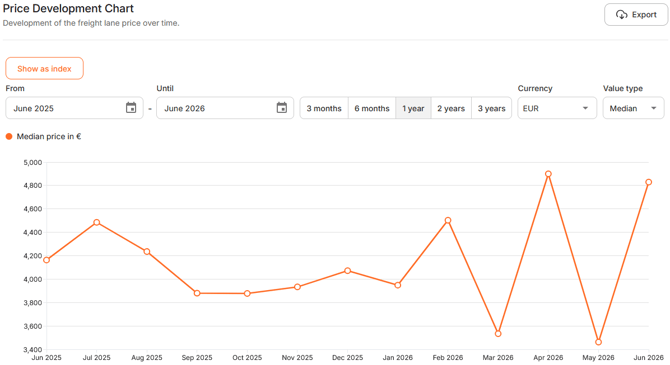
At the bottom, you can review the Price Development Chart. This graph shows the prices for the selected freight lane over time. You can select the desired time period by selecting individual months or by using one of the predefined date ranges.
Use the chart to identify seasonal trends or significant changes in freight rates.
In the top-right corner of the chart, click Export to download the selected data as a PDF or Excel file.