Industry Cost Profiles (ICP) help you understand which cost components make up a product's price. This information can support supplier negotiations and help you identify the main cost drivers within an industry.
We will use a folding paperboard box manufactured in the United States as an example. The corresponding industry is 'Folding Paperboard Box Manufacturing' (NAICS 322212). Search for the NAICS code or enter a keyword such as paperboard to find the ICP.
After selecting the required region, click '+Add selection'.
The 'Results Table' displays the cost breakdown for the selected industry.
By default, the Results Table breaks down the Total (ex works) price into six components:
• Direct Materials
• Direct Labour (in country of production)
• Manufacturing Overhead
• Cost of Sales
• GSA & Other Expenses
• Profit before taxes
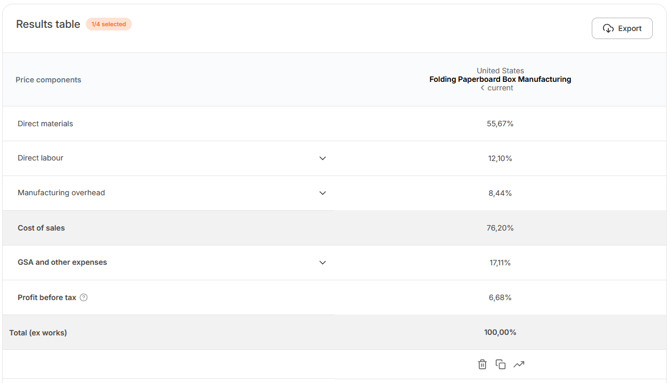
Expand a cost component to view its detailed breakdown.
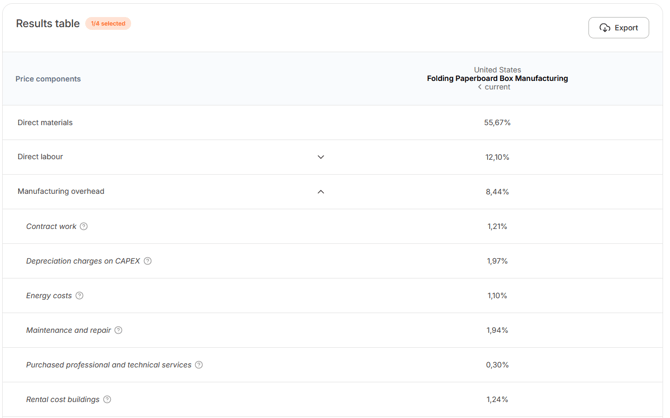
The expanded view shows a more detailed breakdown of each cost component. This information can be very important in negotiations. Suppose a supplier requests a 4% price increase because of rising energy costs. Expand Manufacturing Overhead to see how much energy contributes to the total cost structure. If energy represents only 1.10% of the total cost, a 4% price increase may not be fully supported by the underlying cost structure.
Apply the same approach to the other cost components in this ICP. This helps you understand the main cost drivers in the industry and for your supplier. Use the ICP as a starting point for discussions with your supplier, while keeping in mind that individual companies may have different cost structures.
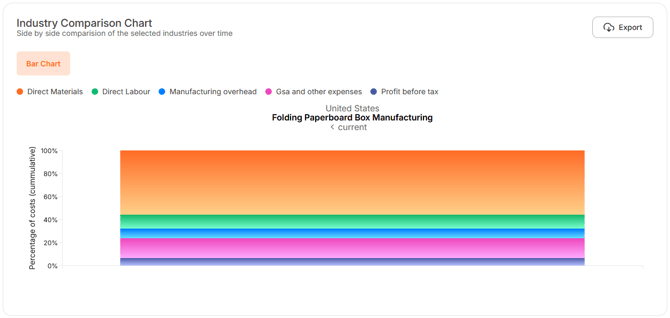
At the bottom, you can also find the 'Industry Composition Chart'. This chart shows how the total cost is distributed across the different cost components. Use this chart to quickly identify which cost components have the greatest impact on the total product cost.