
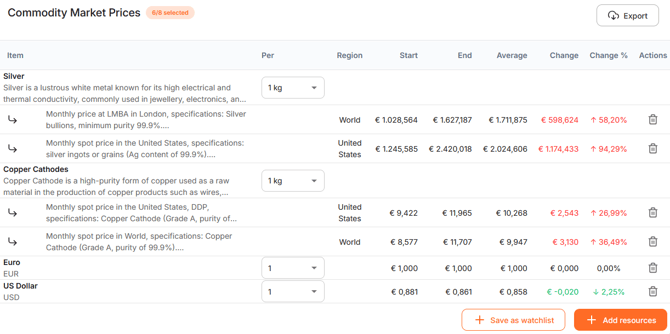
The selected resources (Commodities, Currencies, Energies and Indices) are displayed in the 'Commodity Market Prices' table. The table contains the following column:
- Item: The name of the selected resource
- Per: Here you can adjust the weight unit or amount
- Region: The selected region for the commodity
- Start: The commodity price at the start of the selected period, displayed in the selected currency
- End: The commodity price at the end of the selected period, displayed in the selected currency
- Average: The average commodity price during the selected period.
- Change: The absolute price difference between the start and end of the selected period
- Change %: The percentage difference between the commodity price at the start and end of the selected period
- Action: Remove a resource by clicking the trash bin icon
Tips:
-
Use the average price to compare long-term market levels rather than short-term fluctuations.
-
A positive value indicates the commodity price increased during the selected period.
-
Use the percentage change to compare price movements between different commodities.
 Price Development Chart
If you have added commodities to the table, the 'Price Development Chart' provides a visual representation of the selected resources. The chart has two axis:
- Y-axis shows the commodity price expressed in the selected currency, representing the price of the selected size and weight unit.
- X-axis displays the selecteddate range.
The Show as Index button allows you to compare commodities with very different price levels.
The chart looks as follows:
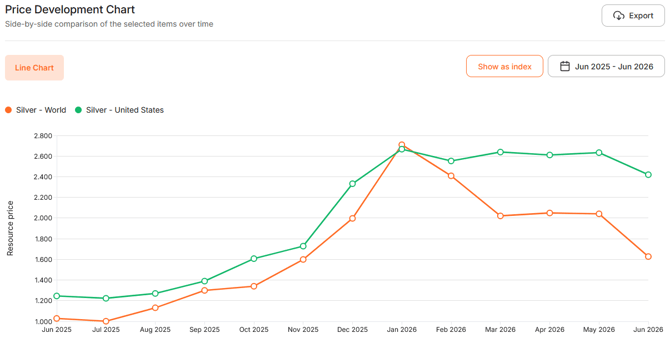
Within the graph you see the button 'Show as index' which allows you to display the data as an index instead of absolute prices. The calendar next to it allows you to change the displayed date range.
The graph shows every data point that is available for your selected resources and connects them with lines. This makes it easy to identify trends over time. When discussing price increases with suppliers, use a longer date range to identify market trends and evaluate whether supplier price increases align with market developments.